Tuesday, March 27, 2007

SPN at Resistance

I keep coming back to Superior Energy Services, Inc (SPN). Back in February, I was watching for a bearish move after a head and shoulders pattern. That pattern failed to confirm and the stock price climbed up to the previous highs. The other strategy that I outlined was a $30 straddle over earnings. That play did unfold nicely and the stock ran up to $34 before the March expiration. If you remember the straddle cost $2.30 and with the stock at $34, there was a $1.70 profit for a cool 74% return. Not bad for 4 weeks in the market.

6 month stock chart for SPNYou can see that SPN is now at it's previous highs around $35. This has been a strong area of resistance since hitting this area back in May '06. The $35.50-$36 area has been hit 5 separate times and has failed to break this level.

The current technicals are all in the over bought zones which tells me that the stock has run out of momentum to break through this resistance. I am also seeing a bearish engulfing candlestick pattern that could very easy mark the end of the current uptrend.

Like a broken record, I am again looking for SPN to drop in price. I am going to target $29 as an area of support that the stock could drop to over the next few months. The June $35 put options are selling for a fair price at $1.90 and a drop to $29 would give the $35 put a minimum value of $6.00 (215% return) depending on the time left before expiration.

With the $35 put being in the money, I will place a 25% trailing stop on the trade.

Special Cash Dividend

I am going to highlight a trade that is not in my regular basket of stock trading strategies. As a matter of fact, I am not going to even trade this strategy with real money. This will be a paper trade to determine the possibility of using this strategy in the future.

6 month stock chart of CMROI found a news announcement for
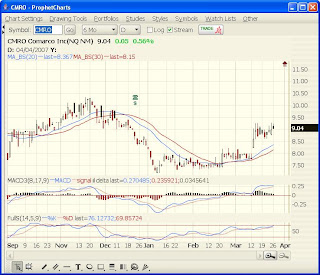
 Comarco Inc (CMRO) regarding a special cash dividend to be paid to the stock holders. Dividends are pretty common things for stock investors to look for. What makes this dividend special is that the company will be paying a full $1.00 per share.

The stock was in a basing pattern at the $8.00 area and gapped up and ran to $9.00 after the announcement. Even at $9.00 the dividend represents a 11% yield. To get this dividend, you must own shares of CMRO stock on April 5th. It is very likely that CMRO will gap back down to the $8.00 price range once the dividend has been pocketed by investors.

My theory is that the pullback to $8.00 will only be temporary seeing the new price level of $9.00. Please remember that this is only my theory and I will be following this stock as a paper trade only.

The stock price has the potential to run up to $10.00 with the nearer term resistance or as high as $12.00 with the longer term resistance. This stock could be played in two different strategies. (1) Buy the stock before April 5th, receive the special cash dividend, then wait for the stock price to return to break even. (2) wait for the stock price to gap down after the dividend an pick up some stock at the discounted price.

I see a couple flaws with the strategy: First, the stock is not fundamentally strong and may not support an uptrend to previous areas of resistance; Second, CMRO will be announcing earning in the near future which is always unpredictable on the stock prices. There are obviously some risks involved with this trade as with any trade.

The reason that I am interested in this trade is that the special cash dividend has increased the visibility of CMRO in the market and an increased visibility could bring new buyers into the stock. New buyers mean higher demand which will bring higher stock prices. If the company is able to make such a large dividend payment, the earnings must be able to support the company into the future without all the extra cash. I would expect a good earnings report.

So what is the trade? I will be placing a paper trade to buy CMRO stock at a price of $9.00 or better. I will then hold my stock through the April 5th ex-dividend date and pocket the dividend. After the expected gap down, I will place a tight stop to protect myself from a continued drop in price.

Now, Let's all see how this plays out.

Thursday, March 8, 2007

Manitowic Diagonal Call Spread

In my last post, I mentioned doing some bargain hunting. All of the fundamentally strong stocks that I picked for a rally produced. The pullback to support for many stocks has generated some very nice technical entry points. I am going to highlight a new trade on Manitowic Company (MTW). Manitowic is fundamentally very strong company which is making money and growing at a good rate. The company is also in a currently strong industry group with neighbors such as Deere (DE), Caterpillar (CAT) and Joy Global (JOYG).

6 month price chart for Manitowic (MTW)The price chart shows a gap down on the last earnings announcement at the end of January with a very powerful bullish run of almost $12 (22%). The stock has since pulled back to an old area of support and bounced nicely off the $55 price level.

On a technical side, the MACD has already rolled up and is heading for a zero line crossover. The Stochastics are also very low and expected to roll over any day.

Overall, I would consider MTW to be in a sideways trend since hitting the magical $55 price point back in October. For this reason and the current market conditions which may produce some more bearish days in the near future, I am projecting a bullish to neutral movement for MTW.

I have placed an order to buy the Jun 55 call option and sell an equal number of April 60 call options as a cover. This particular trade is called a diagonal bull call spread and will cost me a net debit of $4.40 if filled. The trade will be successful if the price moves up to or above $60 by the April expiration. The trade will be unsuccessful and closed if the price breaks and closes below the $55 support.

The power of this strategy is that the June option is less affected by time decay than the April option. This will allow my short position to make money even if the price moves sideways. As expiration gets close, I will have the ability to roll out my short position into May and even June for additional net credits to my account.

As always, please do your own research on any trade that you make in your own account. If you do not have the proper training or education, I strongly recommend that you find a top quality training program and read as many books on trading as possible.

Monday, March 5, 2007

Bargain Hunting for Stocks

Everyone is talking about last week's retreat in the Stock Market. But how bad was the week according to the charts? The Nasdaq 100 Index (NDX) pulled back 1.56% to a price just below it's recent price channel which begin in early November. On the weekly chart, the 30 period moving average acted as support at 1721. The S&P 500 Index (SPX) pulled back 1.14% to the 30 period moving average on the weekly chart. The price corresponds to a short 3 week consolidation area back in October & November. The Dow Jones Industrial Average Index (DJI) pulled back 0.98% to a price level that again reflects old resistance from early November.

Basically the Stock Market has reclaimed all of the market gains since November in a single week. It is widely known that "the market goes up the stairs and out the window". Welcome to just another window. Windows happen often, just look back to March '06 which wiped out 3-4 months profits.

So, what's next? All I can predict is that the market will move either up, down, or sideways. The charts tell us that the markets could be at an area of support. The technicals have fallen very quickly into the over-sold area. The volatility index has jumped up to level seen in May and June.

I think that it is a good time to do some bargain hunting for very strong fundamental stocks. These will be the first to rebound. My watch list would include stocks like Brush Engineered Materials (BW), Allegheny Technology (ATI), Navistar International (NAVZ), General Cable Corp (BGC), and Goodrich Corp (GR). These are some strong fundamental stocks in currently strong industry groups that have fallen to areas of support.

Always remember to trade carefully and know your both your upside targets and your downside escape plan.

Tuesday, February 20, 2007

SPN Bearish Head and Shoulders

I have stopped watching Superior Energy Services (SPN) for a bearish position. The stock dropped to, but failed to break underlying support at $29. It looks as though we have missed the bearish opportunity with both the MACD and Stochastics bottoming out on the daily chart. SPN will be announcing earnings on Feb 26th, so we may get a pre-announcement move this week in either direction. Some people call the straddle a non-directional option strategy, but I like to think of it a bi-directional option strategy. You make money if the stock moves up big or down big. The current March 30 straddle is listed at $2.30 and pretty fairly priced with a little extra weight on the call side. A quick move above $32.30 or below $27.70 would be profitable. That size move is possible over an earnings announcement.

5 month daily chart for SPNBy examining the 5 month chart of SPN, we can see the formation of a head-and-shoulder pattern. The drawn lines identify the shoulder line and the neck lines with an obvious head right in the middle. If this pattern confirms by dropping below neckline (which corresponds to our underlying support), the targeted move is approximately 6 points into the $22-23 area. It's interesting how that matches up with the low on the chart back in Sept. Remember that all patterns need confirmation, and the confirmation of a head and shoulders pattern is a break of the neckline.

I have now discovered two possible strategies for SPN. The short-term earnings straddle would allow for a break in either direction, but requires a quick move to take advantage of the March options. The other strategy is to take the short position in anticipation of the bearish break. A longer term option would be required to take full advantage of a move to $23 or lower. The Jun 30 put is currently at $2.40 at would be valued at better than $7.00 if SPN hits $23 for a 200% return. The June expiration gets us plenty of time for the move to be completed without a major hit to the time value.

Tuesday, February 13, 2007

Technorati

I have listed my blog at the Technorati website. If you enjoy this blog, please mark it as a favorite.

Add to Technorati Favorites

Watch my next post for more stocks added to my watchlist.

Sunday, February 11, 2007

Bearish Stock Watchlist

I am adding Novellus Systems (NVLS) to my watch list for a possible bearish trade. The stock has now made a lower high after bouncing off the 30d MA. I see resistance at $32 confirmed by the doji candlestick. There is support around 29.75-30 and at 26.50-27. I like the March 30 put @ .75 with a target of $3.00 (300% gain). My only concern is that the March expiration is just 5 weeks away. The June 30 puts @ 1.75 would return 200% at the target.

I am also looking at Superior Energy Services (SPN) for a bearish trade. The stock is flashing 3 bearish crossovers (Stochastics, MACD, and 30d MA) but is sitting squarely on a line of support. I will be watching for a break through support @ 29 with a target of $24. I like the March $30 put @ 1.40 with a target of $6.00 (330%). Again, I worry about the March expiration and would have to push out to June 30 put @ $2.35 with a return of 155%.

What do you think? Add your comments and lets discuss these trades and other possible strategies. Maybe a March 32.50/30 bear put spread on NVLS at $1.40 for 78% as long at NVLS drops below $30.

Tuesday, February 6, 2007

CBRX Celebration

Ridgeland, MS, FEB 05, 2007 --
Columbia Laboratories Inc (CBRX) shares, down 70%, where falling on news that its Phase III clinical trial of progesterone for the prevention of preterm birth in women with a previous preterm birth earlier than 35 weeks gestation did not achieve any reduction in the incidence of preterm birth at week 32, the primary endpoint, or at weeks 28, 35 and 37, secondary endpoints of the study.

Let me qualify my celebration after reading the above news clip. I certainly do not celebrate the failure of a drug that could prevent preterm births. What I celebrate is the after 4 weeks of waiting for the results of the clinical trials, my straddle on CBRX paid off.

6 month chart for CBRXI opened a March $5 straddle on Jan 3 after reading an article about the expected announcement some time in Feb. My experiences with Drug companies tells me that these clinical trial can make or break a company. The only safe way to trade this would be to bet on a big move in either direction. If you don't understand the option straddle strategy, I suggest searching Investopedia. (I've included a search box on the left)

My original purchase of the March $5 call and the March $5 put cost me $2.60 total. Obviously I was expecting for a big move in either direction. With the stock at only $5.00, I know my downside would be limited but my upside could be huge. My hoping that my calls make a ton of cash and the puts become worthless.

The stock moved sideways for 4 weeks at a price just below $5.00 and the lower volatility and the time value eating away, I was starting to losing money on both options. That's the way is is with a straddle, if the stock doesn't move, you lose money.

Yesterday the stock gapped down 70% and 22 million shares traded at $1.50. This is more than a 3300% volume spike. For the novice, this is a sign that the company has some bad news. I will be closing my March $5 put this morning for $3.50 for a 34% gain in 4 weeks. I will hold the March $5 call and let it expire worthless.

If you are going to play with drug stocks, play both sides.

Saturday, February 3, 2007

Did You Bring a Bucket?

I have recently experienced some negative and discouraging remarks regarding stock market education programs. It's amazing to me that one person would have extreme successes and another experience extreme frustrations. These two people have been trained in the same stock analysis process, the same technical analysis indicators, and even the same trading strategies by the same instructors. Yet both people are different and their results vary.
How much any one gets out of a lecture depends also upon the size of the bucket he brings to get it in. A big bucket can get filled at a very small stream. A little bucket gets little at the greatest stream. With no bucket you can get nothing at Niagara.

That often explains why one person says a lecture is great, while the next person says he got nothing out of it.

- Ralph Parlette
The University of Hard Knocks

I've listened to The Secrets of the Millionaire Mind by T. Harv Eker many times and there is one line that always caught my ear. He talks about these same two people and how one person might have a tiny leak in their toolbox (and I'm pointing to my head right now). From this one line I knew that I needed to keep my toolbox loaded with the right tools and not let them leak out.

I'm thinking now that it's not only about having a leaky toolbox. It probably also has to do with opening up that toolbox and letting new tools get inside. Being open to new ideas and new opportunities is a big part of not only personal growth but financial growth as well. Once you open up to the fact that anything is possible, you suddenly see all of the new possibilities.

A big part of any stock trader's success is their own outlook on their ability to make money in the stock market. Having the right mental attitude absolutely makes the difference between a successful trader and a frustrated trader. It's called trading psychology and most (if not all) of the books on investing will spend many pages on this area.

Wednesday, January 24, 2007

Riding on RIMM

Research in Motion (RIMM) is the maker of the popular BlackBerry handheld device. The stock can be quite a roller coaster and is popular with some day traders. Well, I have not been day trading this stock, but I am currently in a trade on RIMM.

3 month chart of RIMMI entered a bull put spread trade on Jan 5th with RIMM at a price of $138 per share. I bought the Feb 110p and sold the Feb 115p for a net credit of .55. This is a nice 12% return providing the stock stays above $115 per share on the third Friday of February.

I saw a recent sideways trend with strong support at 125 and 120 and strong overhead resistance at 142-143. I didn't expect a big move above the current price so I would not consider a bullish directional trade. I also ruled out a bearish directional trade because the previous trend was up and a break out of the channel would likely be to the upside.

Looking at the options chain, I noted that the 110/115 puts were serving up a pretty nice premium and a very unlikely chance of expiring in the money (below 115). I placed my order overnight for a .55 credit DAY and was filled early after the opening on the 5th.

Little did I know that in just a few days Apple (AAPL) would announce the new iPhone. AAPL stock jumped up and RIMM took a beating. But RIMM stayed inside the channel and held at 130. Since then it has tested and broke the 125 support level and recently bounced nicely off of the 120 support level.

Right now my position is slightly underwater but with the flexibility of the bid-ask spread I could get out at about break even. This also means that I could probably get into this same trade at the .55 credit and 12% return. The 120 support held nicely and both the MACD and Stochastics indicators are low and rolling up. With just 23 days remaining, the Feb 115p has a 85% chance of expiring worthless. I like those chances so I'll hang on and ride the RIMM.

Thursday, January 18, 2007

Random Thoughts & Stupid Questions

From: The Little Book of Stupid Questions by David Borgenicht

It's better to keep your mouth shut and give the impression that you are stupid than open it and remove all doubt - Rami Belson
What would the world be like if men had to wear high-heels and tight skirts?
Add your thoughts!

News trumps Trend on RACK

Yikes. A bit of news has caused Rackable Systems (RACK) to drop 33%. Earnings are scheduled for release on Feb 1, but the company released a warning about those earnings. Over 30 million shares traded yesterday.

6 month stock chart for RACKI saw the intermediate uptrend since the 52 week lows in Aug. I didn't really pay much attention to the exhaustion gap in Jul as it came after a 4 month drop from the 55 area.

The stock is not that strong fundamentally, but I was long term bullish to neutral. My trade included a Jan 08 30 call (LEAPS) and a Feb 35 call cover. I just needed RACK to drift slowly up to the $35 price range by the Feb expiration. I planned to write the covers every month as an income strategy.

I saw support at 30 and resistance at 37.50. The slow bounce off of support and previous uptrend provided my bullish to neutral outlook.

My flaws on this trade included a lack of downside protection. A stop loss order on this position would have done absolutely nothing to prevent the losses. Gaps are the one thing that cannot be avoided with stop loss orders, your just going to have to take the hit. The proper method of protection would have been to buy an OTM protective put option on the position. Obviously there is some cost involved with buying insurance on your portfolio. This cost will eat into the monthly income of this strategy.

So what about the future of RACK? I don't know, but we can look at the chart for some clues. The stock dropped straight to the $20 neighborhood where if found support just 5 months ago. There might be some bargain buying at this level after the panic subsides. Obviously there was plenty of supply at the $20 mark to absorb 30 million shares.

Against my better judgment and because I already took my beating, I'm going to hang onto my $30 LEAPS and wait for the recovery. The $35 cover will expire worthless in Feb and I will wait for another cover back up at the $30 area in coming months.

Tuesday, January 16, 2007

Recent trade on CHAP

I want to start off this morning with a recent trade that I made on Chaparral Steel (CHAP). CHAP has strong fundamentals and is growing at a good pace. I was watching the stock for a good entry point to make a very short-term option trade.

CHAP 3 month stock chart
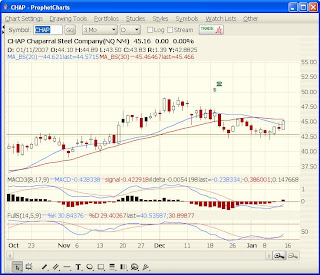
The following analysis is from Jan 10th and 11th.

I saw strong support at 43 from the old resistance in Oct, the break in Nov, and the bounces in Dec and Jan. The MACD has pulled back significantly from the previous uptrend and was providing a bullish crossover. The Stochastics were also low and providing a bullish crossover . This stock seems to have respect for the 30d SMA so my target was just below 46 (confirmed by most recent high).

I was looking at the stock as a 10% trade. The stock has great fundamental numbers and is in a longer term uptrend. The recent pullback to the 43 support area and the white candle following the hammers (confirming the hammer from the previous low) looked like a real nice bounce that could easily run to 45.5. With a possible 1 point move to resistance I could easily get a 10% move on the Feb 45 call (only 3% overvalued).

I ran the numbers and placed my orders at night BTO @ 2.00 triggering a STC @ 2.25 ... A 10% gain after commissions. The BTO was filled at the open (stock @ 44.12) and the STC was filled just 40 minutes later (stock @ 44.71). A nice confidence builder and an extra couple bucks in my trading account. Exact numbers = 9.8% gain on a 1.3% move. My flaws on this trade included no downside protection, I did not have a stop and a move against me would not have been avoided. The stock ended the day lower, but I had already taken my profits off the table.

The stock rallied the next day to close just below the 30d SMA which the stock seems to respect. A break and close above that level could trigger a new bullish trade on CHAP. It is more likely that CHAP will bounce off of that line and start a downtrend.