Wednesday, January 24, 2007

Riding on RIMM

Research in Motion (RIMM) is the maker of the popular BlackBerry handheld device. The stock can be quite a roller coaster and is popular with some day traders. Well, I have not been day trading this stock, but I am currently in a trade on RIMM.

3 month chart of RIMMI entered a bull put spread trade on Jan 5th with RIMM at a price of $138 per share. I bought the Feb 110p and sold the Feb 115p for a net credit of .55. This is a nice 12% return providing the stock stays above $115 per share on the third Friday of February.

I saw a recent sideways trend with strong support at 125 and 120 and strong overhead resistance at 142-143. I didn't expect a big move above the current price so I would not consider a bullish directional trade. I also ruled out a bearish directional trade because the previous trend was up and a break out of the channel would likely be to the upside.

Looking at the options chain, I noted that the 110/115 puts were serving up a pretty nice premium and a very unlikely chance of expiring in the money (below 115). I placed my order overnight for a .55 credit DAY and was filled early after the opening on the 5th.

Little did I know that in just a few days Apple (AAPL) would announce the new iPhone. AAPL stock jumped up and RIMM took a beating. But RIMM stayed inside the channel and held at 130. Since then it has tested and broke the 125 support level and recently bounced nicely off of the 120 support level.

Right now my position is slightly underwater but with the flexibility of the bid-ask spread I could get out at about break even. This also means that I could probably get into this same trade at the .55 credit and 12% return. The 120 support held nicely and both the MACD and Stochastics indicators are low and rolling up. With just 23 days remaining, the Feb 115p has a 85% chance of expiring worthless. I like those chances so I'll hang on and ride the RIMM.

Thursday, January 18, 2007

Random Thoughts & Stupid Questions

From: The Little Book of Stupid Questions by David Borgenicht

It's better to keep your mouth shut and give the impression that you are stupid than open it and remove all doubt - Rami Belson
What would the world be like if men had to wear high-heels and tight skirts?
Add your thoughts!

News trumps Trend on RACK

Yikes. A bit of news has caused Rackable Systems (RACK) to drop 33%. Earnings are scheduled for release on Feb 1, but the company released a warning about those earnings. Over 30 million shares traded yesterday.

6 month stock chart for RACKI saw the intermediate uptrend since the 52 week lows in Aug. I didn't really pay much attention to the exhaustion gap in Jul as it came after a 4 month drop from the 55 area.

The stock is not that strong fundamentally, but I was long term bullish to neutral. My trade included a Jan 08 30 call (LEAPS) and a Feb 35 call cover. I just needed RACK to drift slowly up to the $35 price range by the Feb expiration. I planned to write the covers every month as an income strategy.

I saw support at 30 and resistance at 37.50. The slow bounce off of support and previous uptrend provided my bullish to neutral outlook.

My flaws on this trade included a lack of downside protection. A stop loss order on this position would have done absolutely nothing to prevent the losses. Gaps are the one thing that cannot be avoided with stop loss orders, your just going to have to take the hit. The proper method of protection would have been to buy an OTM protective put option on the position. Obviously there is some cost involved with buying insurance on your portfolio. This cost will eat into the monthly income of this strategy.

So what about the future of RACK? I don't know, but we can look at the chart for some clues. The stock dropped straight to the $20 neighborhood where if found support just 5 months ago. There might be some bargain buying at this level after the panic subsides. Obviously there was plenty of supply at the $20 mark to absorb 30 million shares.

Against my better judgment and because I already took my beating, I'm going to hang onto my $30 LEAPS and wait for the recovery. The $35 cover will expire worthless in Feb and I will wait for another cover back up at the $30 area in coming months.

Tuesday, January 16, 2007

Recent trade on CHAP

I want to start off this morning with a recent trade that I made on Chaparral Steel (CHAP). CHAP has strong fundamentals and is growing at a good pace. I was watching the stock for a good entry point to make a very short-term option trade.

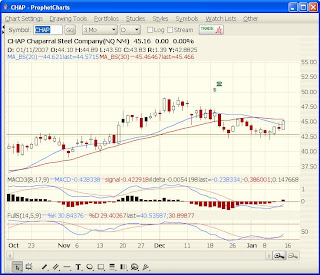
CHAP 3 month stock chartThe following analysis is from Jan 10th and 11th.

I saw strong support at 43 from the old resistance in Oct, the break in Nov, and the bounces in Dec and Jan. The MACD has pulled back significantly from the previous uptrend and was providing a bullish crossover. The Stochastics were also low and providing a bullish crossover . This stock seems to have respect for the 30d SMA so my target was just below 46 (confirmed by most recent high).

I was looking at the stock as a 10% trade. The stock has great fundamental numbers and is in a longer term uptrend. The recent pullback to the 43 support area and the white candle following the hammers (confirming the hammer from the previous low) looked like a real nice bounce that could easily run to 45.5. With a possible 1 point move to resistance I could easily get a 10% move on the Feb 45 call (only 3% overvalued).

I ran the numbers and placed my orders at night BTO @ 2.00 triggering a STC @ 2.25 ... A 10% gain after commissions. The BTO was filled at the open (stock @ 44.12) and the STC was filled just 40 minutes later (stock @ 44.71). A nice confidence builder and an extra couple bucks in my trading account. Exact numbers = 9.8% gain on a 1.3% move. My flaws on this trade included no downside protection, I did not have a stop and a move against me would not have been avoided. The stock ended the day lower, but I had already taken my profits off the table.

The stock rallied the next day to close just below the 30d SMA which the stock seems to respect. A break and close above that level could trigger a new bullish trade on CHAP. It is more likely that CHAP will bounce off of that line and start a downtrend.