Tuesday, March 27, 2007

SPN at Resistance

I keep coming back to Superior Energy Services, Inc (SPN). Back in February, I was watching for a bearish move after a head and shoulders pattern. That pattern failed to confirm and the stock price climbed up to the previous highs. The other strategy that I outlined was a $30 straddle over earnings. That play did unfold nicely and the stock ran up to $34 before the March expiration. If you remember the straddle cost $2.30 and with the stock at $34, there was a $1.70 profit for a cool 74% return. Not bad for 4 weeks in the market.

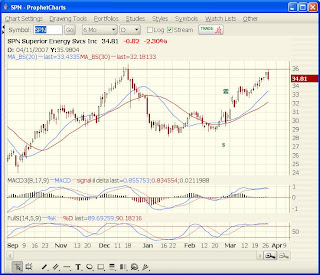
6 month stock chart for SPNYou can see that SPN is now at it's previous highs around $35. This has been a strong area of resistance since hitting this area back in May '06. The $35.50-$36 area has been hit 5 separate times and has failed to break this level.

The current technicals are all in the over bought zones which tells me that the stock has run out of momentum to break through this resistance. I am also seeing a bearish engulfing candlestick pattern that could very easy mark the end of the current uptrend.

Like a broken record, I am again looking for SPN to drop in price. I am going to target $29 as an area of support that the stock could drop to over the next few months. The June $35 put options are selling for a fair price at $1.90 and a drop to $29 would give the $35 put a minimum value of $6.00 (215% return) depending on the time left before expiration.

With the $35 put being in the money, I will place a 25% trailing stop on the trade.

Special Cash Dividend

I am going to highlight a trade that is not in my regular basket of stock trading strategies. As a matter of fact, I am not going to even trade this strategy with real money. This will be a paper trade to determine the possibility of using this strategy in the future.
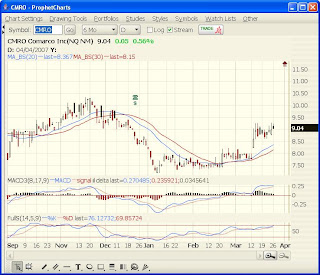
6 month stock chart of CMROI found a news announcement for Comarco Inc (CMRO) regarding a special cash dividend to be paid to the stock holders. Dividends are pretty common things for stock investors to look for. What makes this dividend special is that the company will be paying a full $1.00 per share.

The stock was in a basing pattern at the $8.00 area and gapped up and ran to $9.00 after the announcement. Even at $9.00 the dividend represents a 11% yield. To get this dividend, you must own shares of CMRO stock on April 5th. It is very likely that CMRO will gap back down to the $8.00 price range once the dividend has been pocketed by investors.

My theory is that the pullback to $8.00 will only be temporary seeing the new price level of $9.00. Please remember that this is only my theory and I will be following this stock as a paper trade only.

The stock price has the potential to run up to $10.00 with the nearer term resistance or as high as $12.00 with the longer term resistance. This stock could be played in two different strategies. (1) Buy the stock before April 5th, receive the special cash dividend, then wait for the stock price to return to break even. (2) wait for the stock price to gap down after the dividend an pick up some stock at the discounted price.

I see a couple flaws with the strategy: First, the stock is not fundamentally strong and may not support an uptrend to previous areas of resistance; Second, CMRO will be announcing earning in the near future which is always unpredictable on the stock prices. There are obviously some risks involved with this trade as with any trade.

The reason that I am interested in this trade is that the special cash dividend has increased the visibility of CMRO in the market and an increased visibility could bring new buyers into the stock. New buyers mean higher demand which will bring higher stock prices. If the company is able to make such a large dividend payment, the earnings must be able to support the company into the future without all the extra cash. I would expect a good earnings report.

So what is the trade? I will be placing a paper trade to buy CMRO stock at a price of $9.00 or better. I will then hold my stock through the April 5th ex-dividend date and pocket the dividend. After the expected gap down, I will place a tight stop to protect myself from a continued drop in price.

Now, Let's all see how this plays out.
Thursday, March 8, 2007

Manitowic Diagonal Call Spread

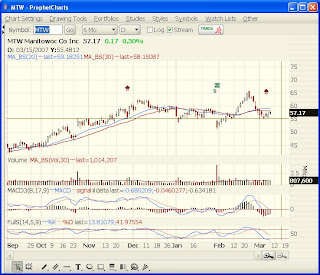
In my last post, I mentioned doing some bargain hunting. All of the fundamentally strong stocks that I picked for a rally produced. The pullback to support for many stocks has generated some very nice technical entry points. I am going to highlight a new trade on Manitowic Company (MTW). Manitowic is fundamentally very strong company which is making money and growing at a good rate. The company is also in a currently strong industry group with neighbors such as Deere (DE), Caterpillar (CAT) and Joy Global (JOYG).

6 month price chart for Manitowic (MTW)The price chart shows a gap down on the last earnings announcement at the end of January with a very powerful bullish run of almost $12 (22%). The stock has since pulled back to an old area of support and bounced nicely off the $55 price level.

On a technical side, the MACD has already rolled up and is heading for a zero line crossover. The Stochastics are also very low and expected to roll over any day.

Overall, I would consider MTW to be in a sideways trend since hitting the magical $55 price point back in October. For this reason and the current market conditions which may produce some more bearish days in the near future, I am projecting a bullish to neutral movement for MTW.

I have placed an order to buy the Jun 55 call option and sell an equal number of April 60 call options as a cover. This particular trade is called a diagonal bull call spread and will cost me a net debit of $4.40 if filled. The trade will be successful if the price moves up to or above $60 by the April expiration. The trade will be unsuccessful and closed if the price breaks and closes below the $55 support.

The power of this strategy is that the June option is less affected by time decay than the April option. This will allow my short position to make money even if the price moves sideways. As expiration gets close, I will have the ability to roll out my short position into May and even June for additional net credits to my account.

As always, please do your own research on any trade that you make in your own account. If you do not have the proper training or education, I strongly recommend that you find a top quality training program and read as many books on trading as possible.

Monday, March 5, 2007

Bargain Hunting for Stocks

Everyone is talking about last week's retreat in the Stock Market. But how bad was the week according to the charts? The Nasdaq 100 Index (NDX) pulled back 1.56% to a price just below it's recent price channel which begin in early November. On the weekly chart, the 30 period moving average acted as support at 1721. The S&P 500 Index (SPX) pulled back 1.14% to the 30 period moving average on the weekly chart. The price corresponds to a short 3 week consolidation area back in October & November. The Dow Jones Industrial Average Index (DJI) pulled back 0.98% to a price level that again reflects old resistance from early November.

Basically the Stock Market has reclaimed all of the market gains since November in a single week. It is widely known that "the market goes up the stairs and out the window". Welcome to just another window. Windows happen often, just look back to March '06 which wiped out 3-4 months profits.

So, what's next? All I can predict is that the market will move either up, down, or sideways. The charts tell us that the markets could be at an area of support. The technicals have fallen very quickly into the over-sold area. The volatility index has jumped up to level seen in May and June.

I think that it is a good time to do some bargain hunting for very strong fundamental stocks. These will be the first to rebound. My watch list would include stocks like Brush Engineered Materials (BW), Allegheny Technology (ATI), Navistar International (NAVZ), General Cable Corp (BGC), and Goodrich Corp (GR). These are some strong fundamental stocks in currently strong industry groups that have fallen to areas of support.

Always remember to trade carefully and know your both your upside targets and your downside escape plan.