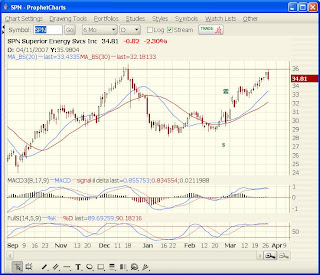
 You can see that SPN is now at it's previous highs around $35. This has been a strong area of resistance since hitting this area back in May '06. The $35.50-$36 area has been hit 5 separate times and has failed to break this level.
The current technicals are all in the over bought zones which tells me that the stock has run out of momentum to break through this resistance. I am also seeing a bearish engulfing candlestick pattern that could very easy mark the end of the current uptrend.
Like a broken record, I am again looking for SPN to drop in price. I am going to target $29 as an area of support that the stock could drop to over the next few months. The June $35 put options are selling for a fair price at $1.90 and a drop to $29 would give the $35 put a minimum value of $6.00 (215% return) depending on the time left before expiration.
With the $35 put being in the money, I will place a 25% trailing stop on the trade.

1 comment:
Hi Paul,
Looking at your SPN chart today (4/7) it looks to me like a cup and handle formation, with the handle forming now. Break above 35.80 could presage a 7 point move. What are your thoughts on this?
Ernie (Birmingham group)
Post a Comment